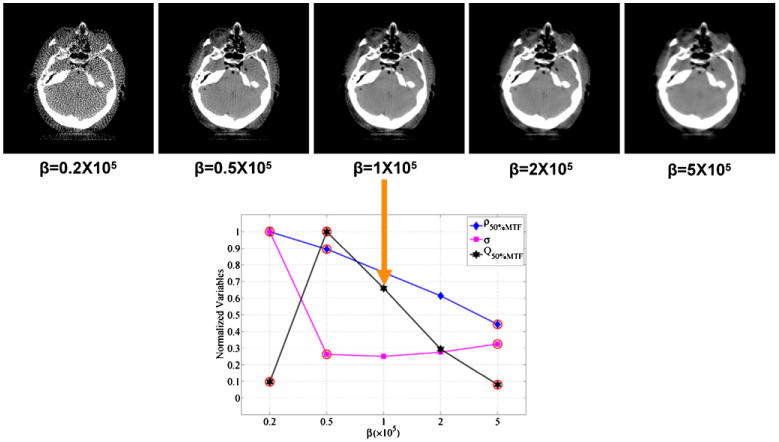
Figure 2.

Demonstration of the selection procedure for the β parameter in the comparative studies. The points which have been circled have above average SI values and are eliminated from the selection process. From the remaining points, the image with the highest Q value is selected to determine the choice of β. This example is for qGGMRF with 160 views at 0.8 mAs.
