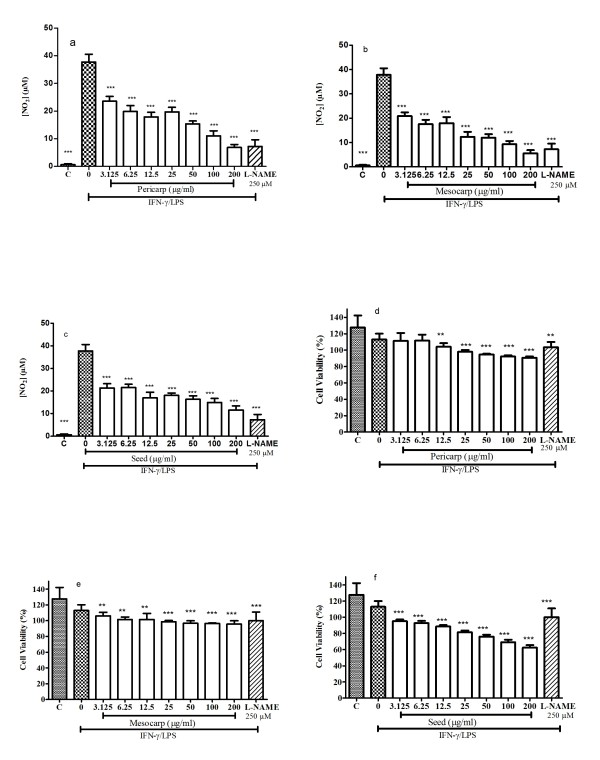
Figure 6.
Nitric oxide (NO) production level (a, b, c) and RAW 264.7 cell viability (d, e, f) in the presence of pericarp, mesocarp, and seed. C; basal level of nitrite concentration without IFN-γ/LPS-treatment. All values are mean ± S.E.M. of three different experiments. *P < 0.05, **P < < 0.01, ***P < 0.001 significantly different from the IFN-γ/LPS-treated control group.

