
Figure 6.
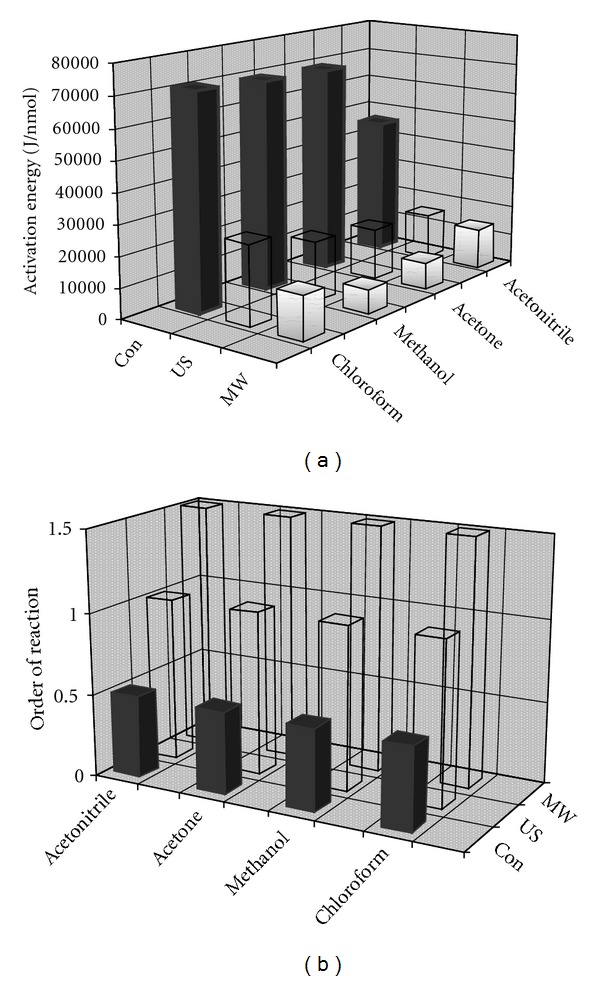
Values of Ea (a) and n (b) for the allicin transformation by conventional method (Con), under the influence of ultrasound (US) and microwaves (MW).
Official websites use .gov
A
.gov website belongs to an official
government organization in the United States.
Secure .gov websites use HTTPS
A lock (
) or https:// means you've safely
connected to the .gov website. Share sensitive
information only on official, secure websites.
Values of Ea (a) and n (b) for the allicin transformation by conventional method (Con), under the influence of ultrasound (US) and microwaves (MW).