Figure 6.

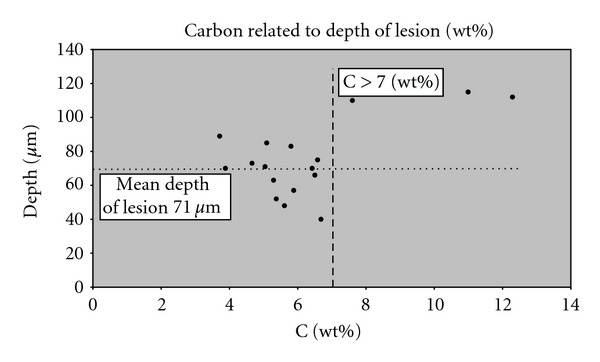
Plot of the wt% of carbon related to depth of lesion. Circle marks the specimen with wt% of carbon >7%. which also have deeper lesion.

Plot of the wt% of carbon related to depth of lesion. Circle marks the specimen with wt% of carbon >7%. which also have deeper lesion.