Figure 2.

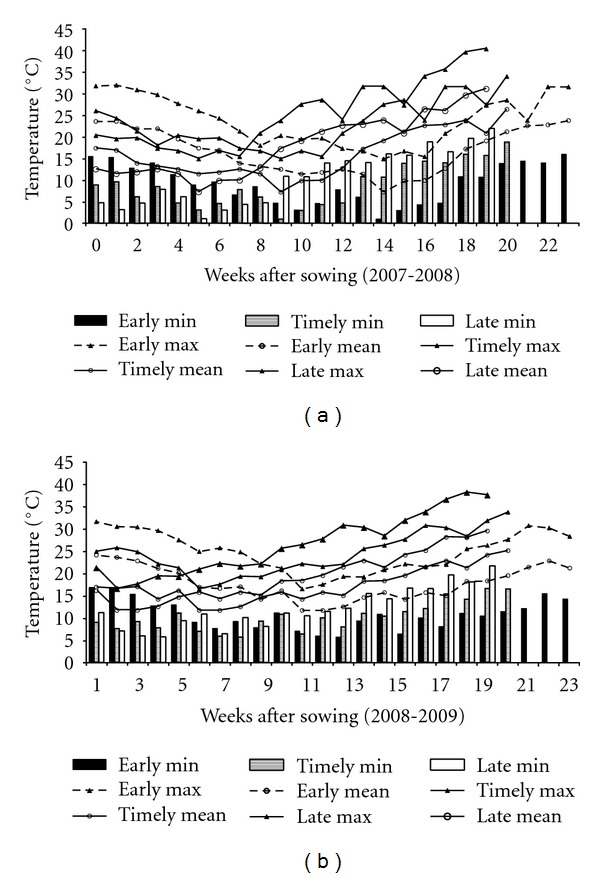
Patterns of weekly temperatures during the wheat growing season for the year 2007-2008 (year I) and 2008-2009 (year II).

Patterns of weekly temperatures during the wheat growing season for the year 2007-2008 (year I) and 2008-2009 (year II).