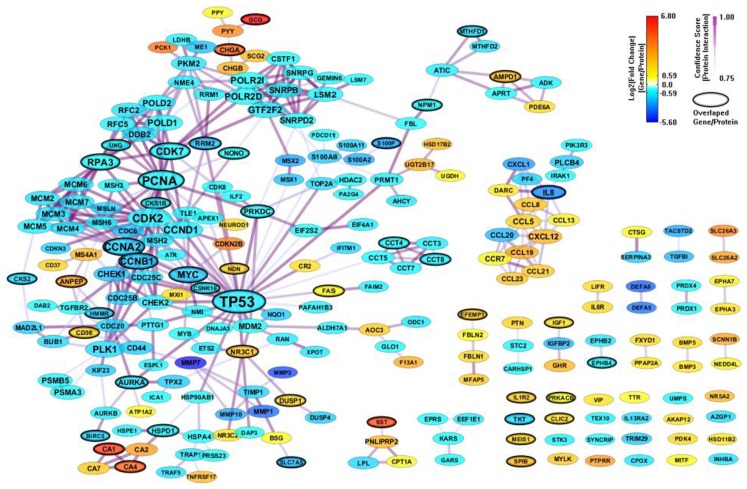
Figure 3.
A PPI network based on the enriched genes from MSigDB by through analyzing GSE8671 by gene set enrichment analysis (GSEA). The genes/proteins in the network were obtained from GSEA analysis using “colon” related gene signatures searched from MSigDB. Node colors represent differential gene expressions, node size represents the local topological property, edge color, and edge width represents confidence score for each protein interaction. Black-circled genes represent the enriched genes from both MSigDB and GeneSigDB.

