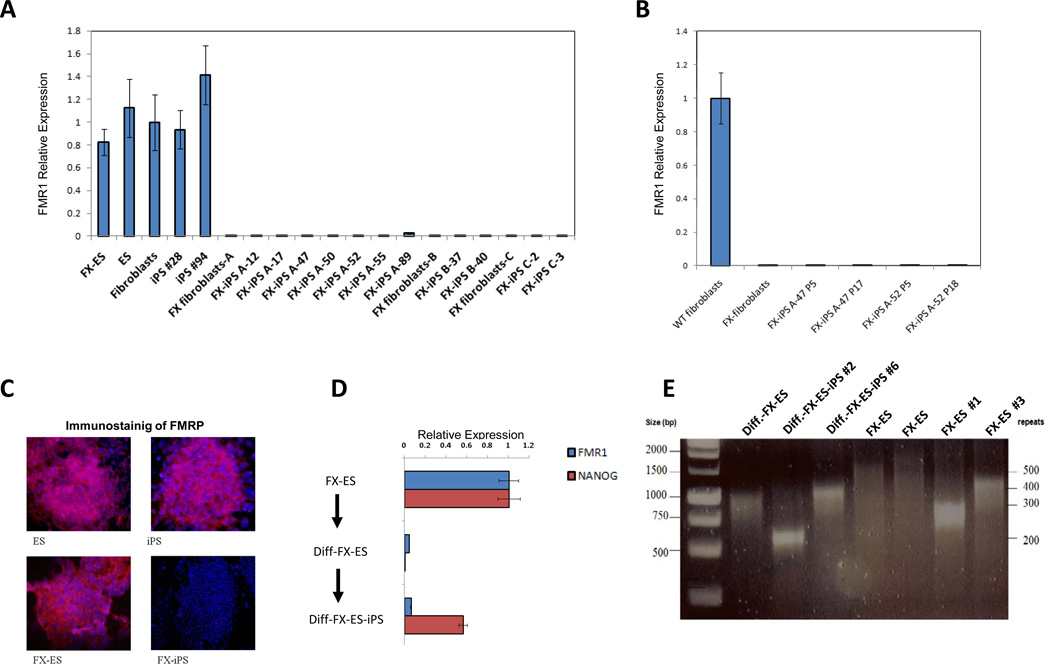
Figure 1. FMR1 expression in FX-iPS cells.
A. FMR1 transcript expression as analyzed by real-time PCR in FX-ES cells, normal ES cells, normal fibroblasts, two normal iPS cell clones, FX-fibroblasts from three different patients (A, B, C), and eleven FX-iPS cell clones derived from the FX-fibroblasts. B. Comparison of FMR1 expression levels in two FX-iPS cell clones at low passage (p5) and high passage (p17 and p18). C. Immunostaining for FMRP in ES, iPS, FX-ES and FX-iPS cells using goat anti human FMRP antibody and Hoechst 33258 for nuclear staining. D. FMR1 and NANOG expression levels in FX-ES cells, Diff-FX-ES cells (a population of cells differentiated from FX-ES cells), and Diff-FX-ES-iPS cells (iPS cells derived from differentiated FX-ES cells). E. Analysis of CGG repeat number in Diff-FX-ES, Diff-FX-ES-iPS clones #2 and #6, two samples of FX-ES cells, and two subclones of the FX-ES cells. Note that the Diff.-FX-ES and the FX-ES represent cell populations that are heterogeneous with respect to CGG repeat number (Eiges et al, 2007), whereas in the Diff-FX-ES-iPS and the FX-ES subclones a dominant band indicates the more homogenous population expected in subclones. The size of the DNA marker bands in base pairs and the number of the CGG repeats are shown at the left and right sides of the gel, respectively. For further characterization of the undifferentiated iPS clones and their pluripotency see also supplementary figures 1,2.

