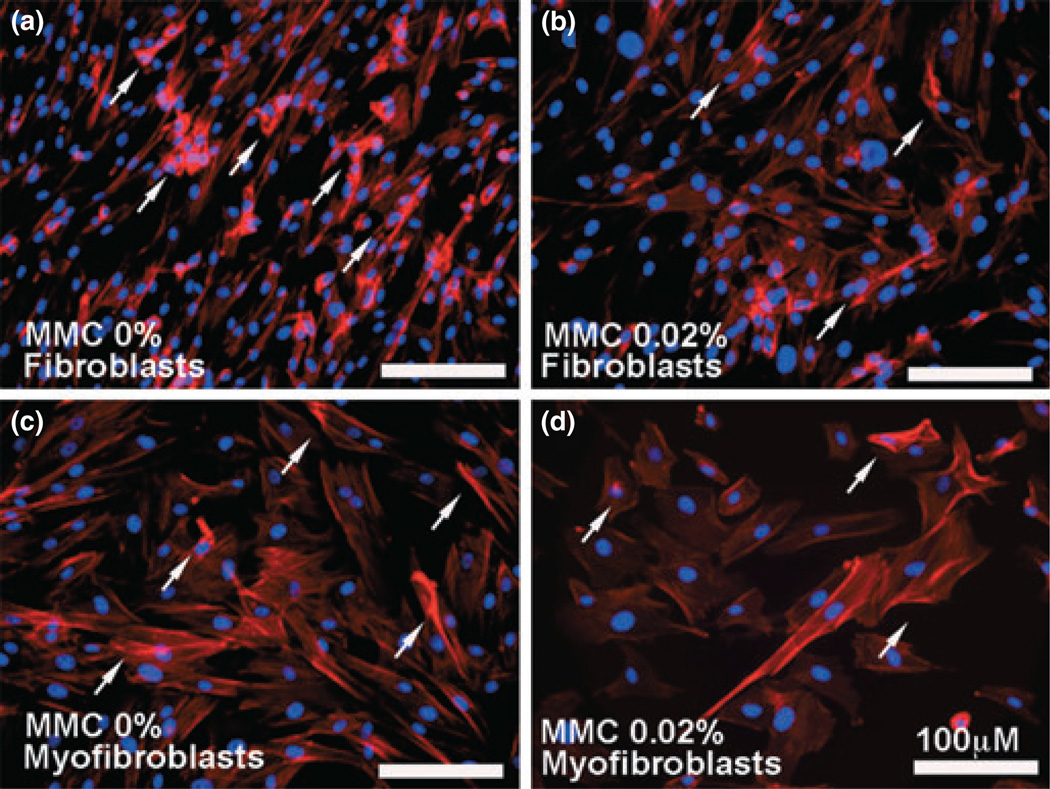
Figure 4.
Immunofluorescence studies demonstrating F-actin expression. Compared to the untreated controls (a, c), the 0.02% mitomycin C (MMC) treatment to canine corneal fibroblast (b) and myofibroblast cells (d) significantly reduced expression of F-actin (51–59%; P < 0.01) as per digital quantification. The arrows indicate F-actin positive cells. Nuclei are stained blue with DAPI; scale bar denotes 100 µm.

