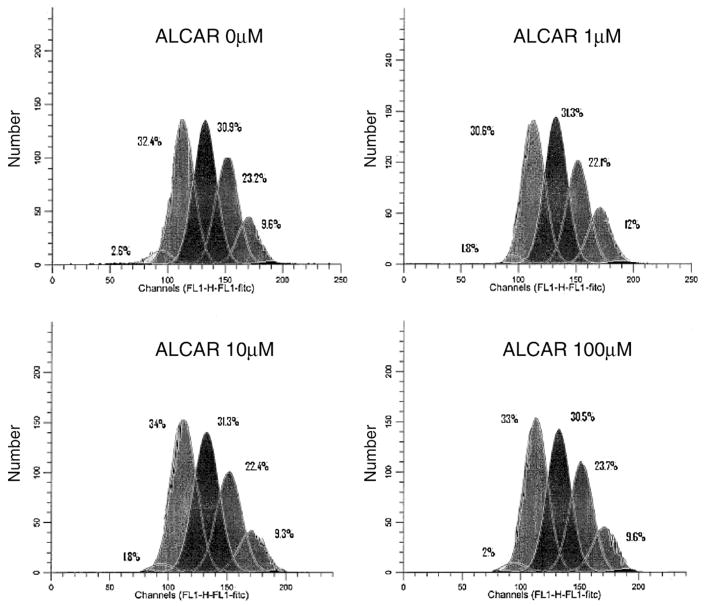
Fig. 2.
OVCAR-3 proliferation profile in response to ALCAR. Shown is the proliferation graph of OVCAR-3 cells grown in varying ALCAR concentrations. Each peak represents a generation, with the higher generation (6th generation) on the left, and down to the 2nd generation on the far right. The addition of ALCAR did not make a significant difference in the rate of proliferation.

