Figure 2.

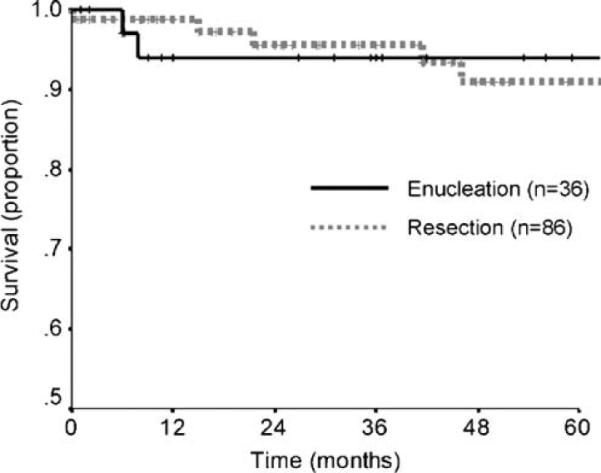
Kaplan–Meier actuarial survival curve comparing patients who underwent enucleation (n=36) versus those who underwent resection (n=86) (P=0.50 by log-rank test).

Kaplan–Meier actuarial survival curve comparing patients who underwent enucleation (n=36) versus those who underwent resection (n=86) (P=0.50 by log-rank test).