


FIGURE 2. Discovery of 12p13.33 as a susceptibility locus for squamous cell carcinoma of the lung.
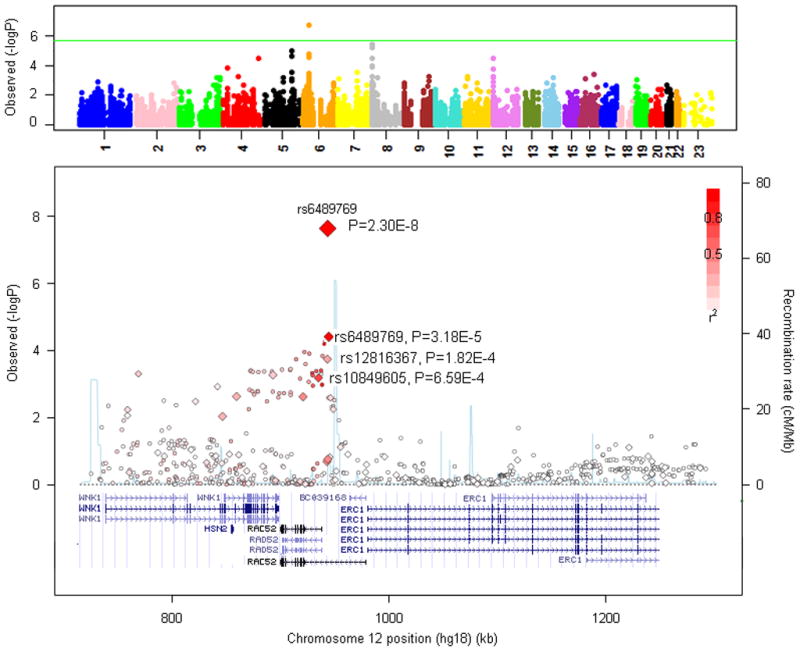
Upper panel: Manhattan plot of P-values from the inflammation pathway gene SNPs in the NCI SQ discovery data. The green line corresponds to the Bonferroni threshold of p=2.6×10⁻⁶ for the 19,082 SNPs included in the pathway analysis. Lower panel: Regional plot of the 12p13.33 SQ susceptibility locus. Plot shows association results of genotyped (diamonds) and imputed (circles) SNPs, along with recombination rates (light blue lines) estimated from the HapMap CEU samples. SNPs are colored based on their LD with rs6489769. The size of the diamonds indicates the strength of association. Genes in the region are annotated with locations and orientations using the UCSC genome browser.