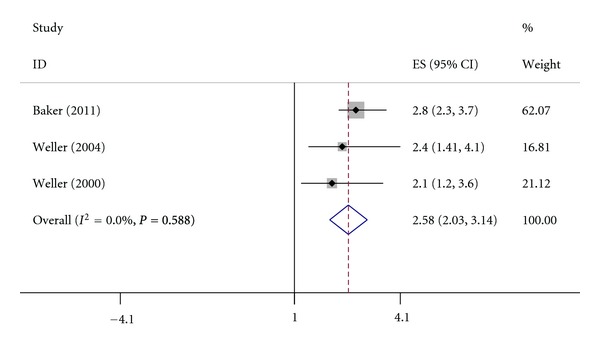
Figure 2.

Pooled estimate of ES and 95% CI of AD and hip fracture (used OR and 95% CI fixed). ES is represented by squares, whose sizes are proportional to the sample size of the relative study. The whiskers represent the 95% CI. The diamond represents the pooled estimate based on the random effects model, with the centre representing the point estimate and the width the associated 95% CI.
