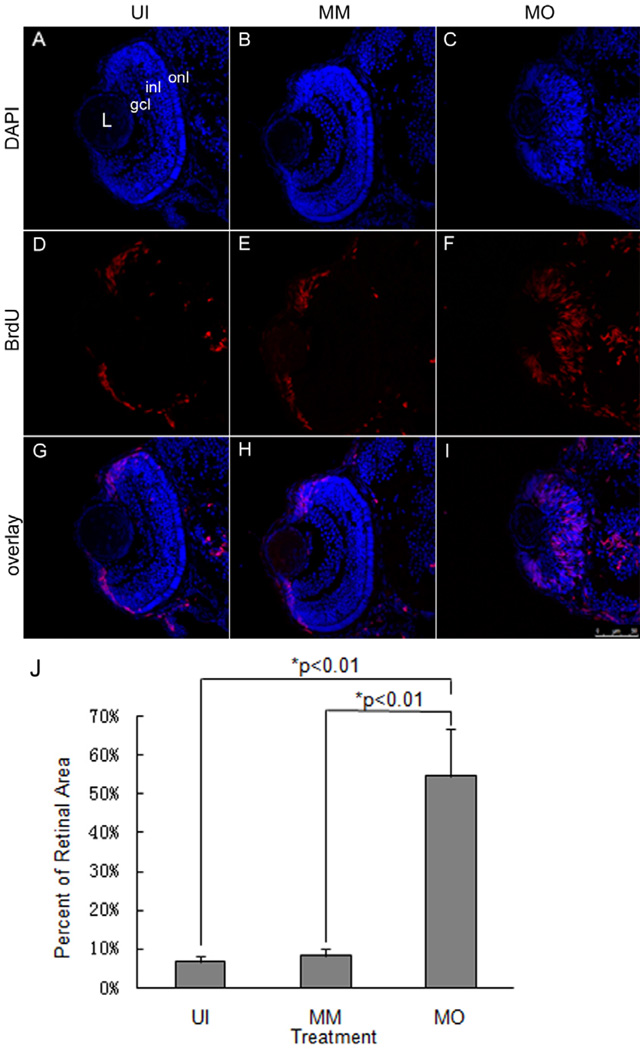
Figure 3. The fms morphant retina remains as neuroepithelium at 72 hpf.
Systemic BrdU was used to label mitotically active cells in the retinas of uninjected (UI), mismatch controls (MM) and fms morphants (MO) at 72 hpf, respectively. Note the expanded distribution of BrdU-positive cells in the fms morphant retina. L, lens; gcl, ganglion cell layer; inl, inner nuclear layer; onl, outer nuclear layer. Scale bar: 75 µm. Panel J illustrates the quantitative comparison of the proportion of the retina occupied by BrdU-positive cells (n=10 larvae/treatment group). There were statistically significant differences between the control and morphant retinas (p<0.01; ANOVA).

