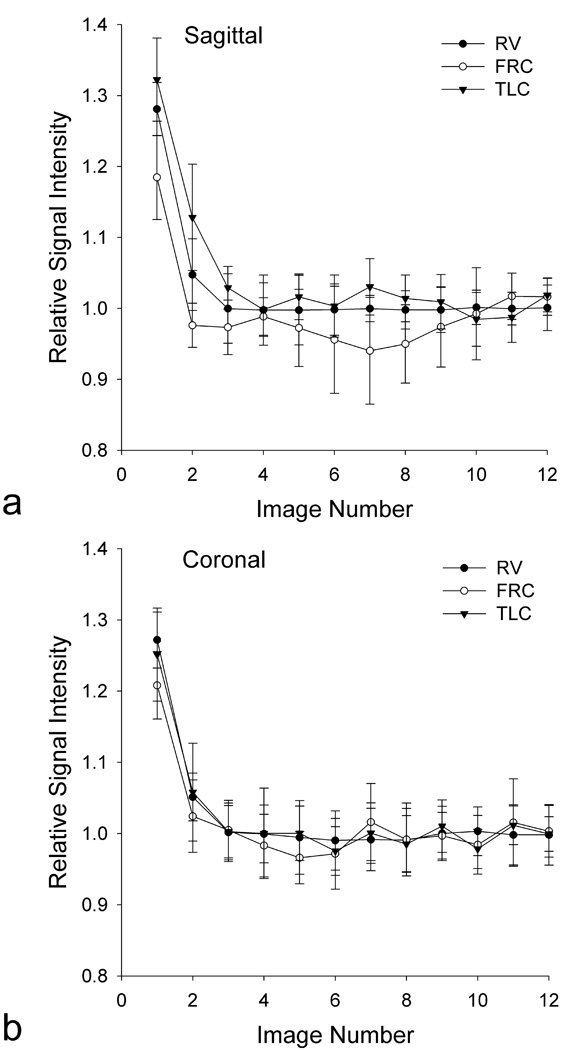
Figure 2.
Average signal of the lung from 12 successive images divided by the average of the last 4 images, showing the approach to steady-state for a single subject. Error bars show the SD over the 5 repetitions at each image number divided by the average of the last 4 images. Results are shown for the (a) sagittal and (b) coronal imaging plane at RV, FRC, and TLC. The signal of the lung does not reach steady state until image 4 in both imaging planes and at all 3 lung volumes.

