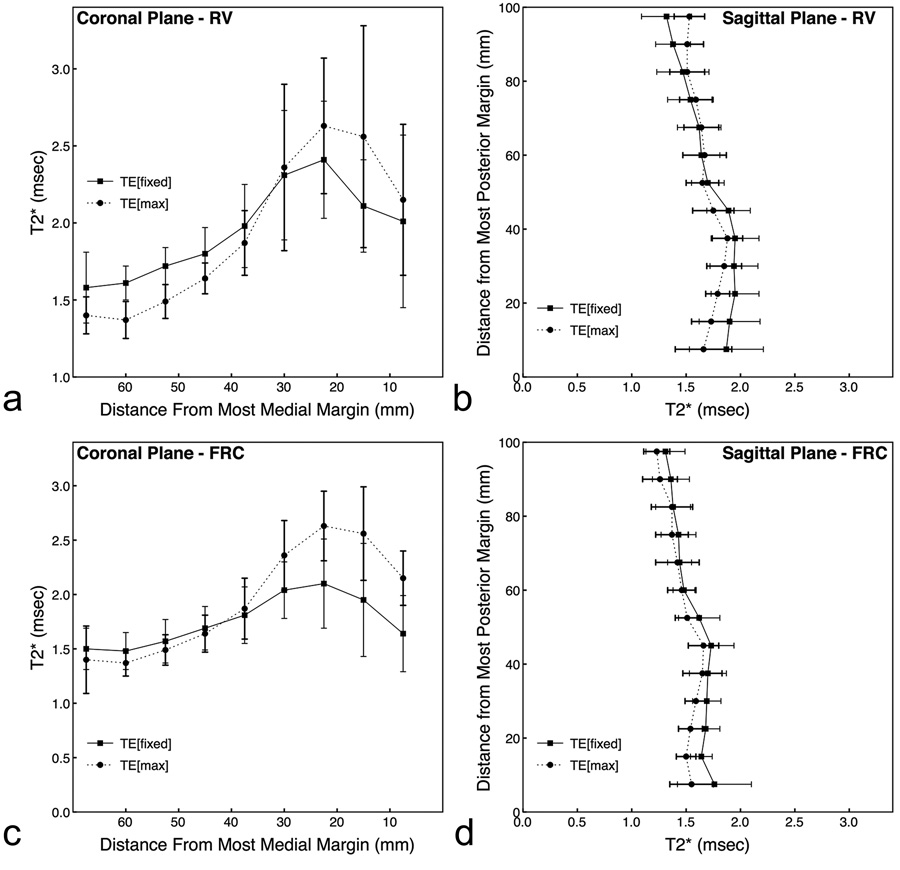
Figure 3.
Effects of using different TE values on estimates of T2*. Spatial results are from data acquired at RV (a,b: scans 1 and 4 in Table 1), and FRC (c,d: scans 2 and 5 in Table 1) in the coronal (a,c) and sagittal (b,d) imaging planes at either a fixed TE2 (square–solid line) or TE[max] (circle–dotted line). There was no significant main effect for TE2 (TE[fixed] vs TE[max]) for data acquired at sagittal RV (P = 0.36), coronal RV (P = 0.90) and coronal FRC (P = 0.11) for T2* averaged over all lung ROIs. There was a significant effect main effect for TE2 for sagittal FRC (P = 0.0002). There was also a significant lung region (ROI) by echo time interaction for RV and FRC in both planes (P< 0.04).

