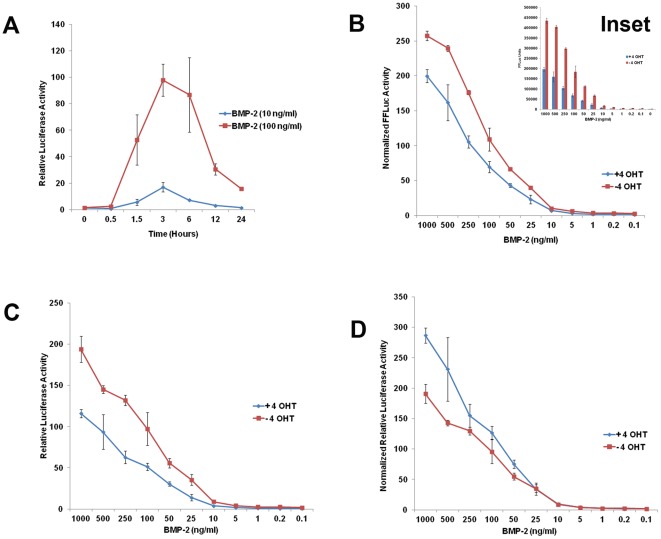
Figure 3.
(A) Time course analysis showing relative FFLuc activity in presence of 100 ng/ml (red line) and 10 ng/ml (blue line) BMP2 concentrations at different time points indicated. (B) Normalized FFLuc activity, (Inset showing absolute values of FFLuc activity) after 3 hours of stimulation with different BMP2 concentrations in presence (blue line) or absence (red line) of 4-OHT. (C) Relative luciferase activity after 3 hours of stimulation with different BMP2 concentrations in presence (blue line) or absence (red line) of 4-OHT. (D) Normalized relative luciferase activity after 3 hours of stimulation with different BMP2 concentrations in presence (blue line) or absence (red line) of 4-OHT. Data shown are means ± SEM of three independent experiments carried out in triplicates.

