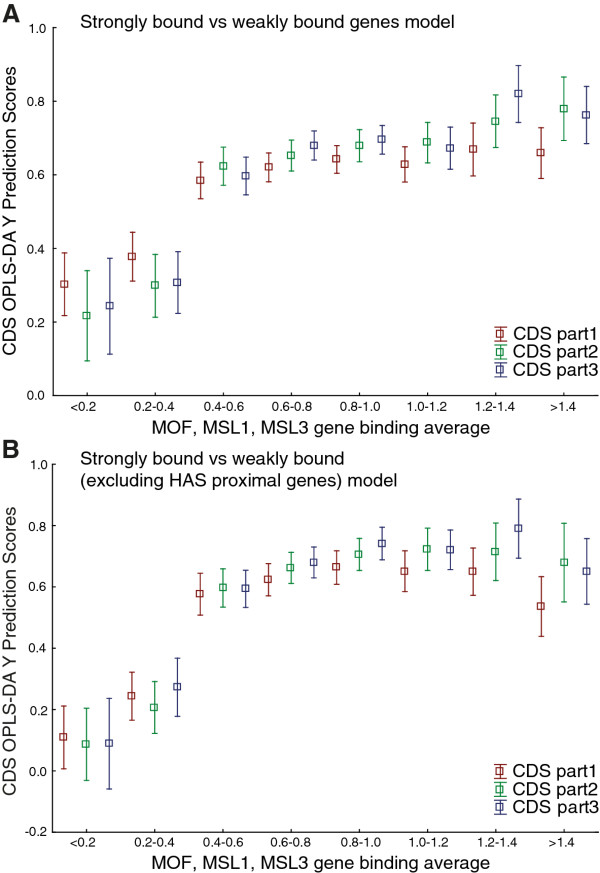
Figure 5.
Results from CDS of MSL-bound genes. Results based on OPLS-DA of CDS of genes that are expressed and strongly or weakly bound by MSL complex on chromosome X. (A) OPLS-DA Y Prediction scores of three equally sized parts of CDS from all expressed genes on chromosome X compared to average MSL enrichment (average of MSL-1, MSL-3 and MOF binding values). OPLS-DA model based on CDS of MSL complex strongly and weakly bound genes. Note that the weakly bound genes in the model have an average binding value for the three proteins of 0.24 and 90% fall into the first two binding classes (< 0.2 and 0.2-0.4). Weakly bound genes were selected as genes that had gene binding values for all the three proteins lower than 0.5. (B) OPLS-DA Y Prediction scores of three equally sized parts of CDS from all expressed genes compared to average MSL enrichment. OPLS-DA model based on CDS of MSL complex strongly and weakly bound genes 5 Kb away from any HAS.

