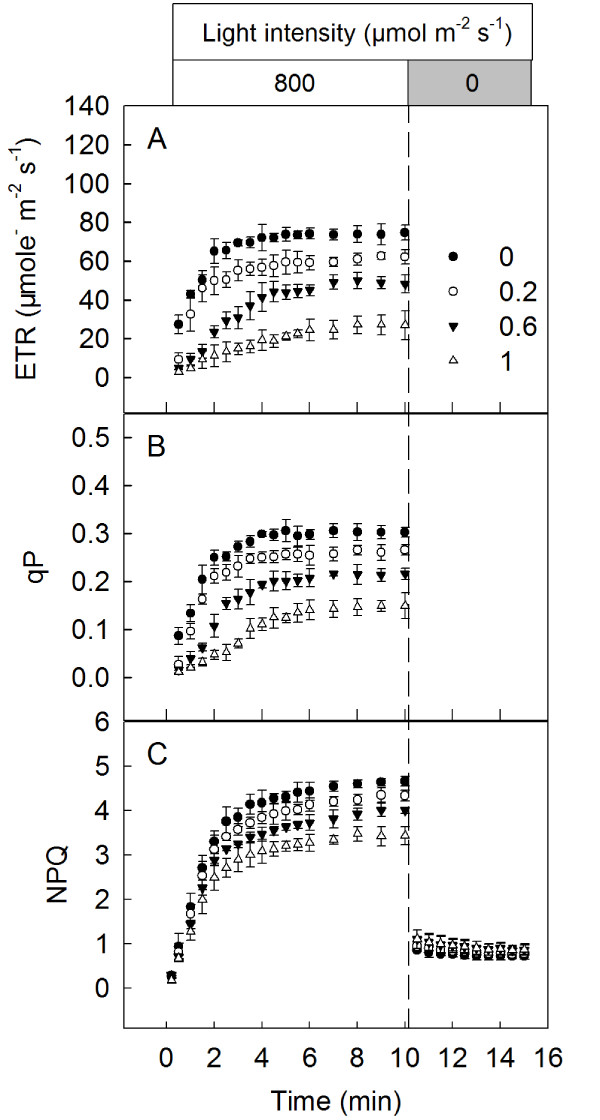
Figure 9.
The changes in the ETR (A), qP (B) and NPQ (C) during the induction phase of photosynthesis in Rumex K-1 leaves treated with 0 (control), 0.2, 0.6 or 1 mM SHAM. Leaf discs were infiltrated with 0 (control), 0.2, 0.6 or 1 mM SHAM respectively in the dark for 2 h, then the induction and quenching kinetics of the ETR, qP and NPQ were measured. Means ± SE of five replicates are presented.

