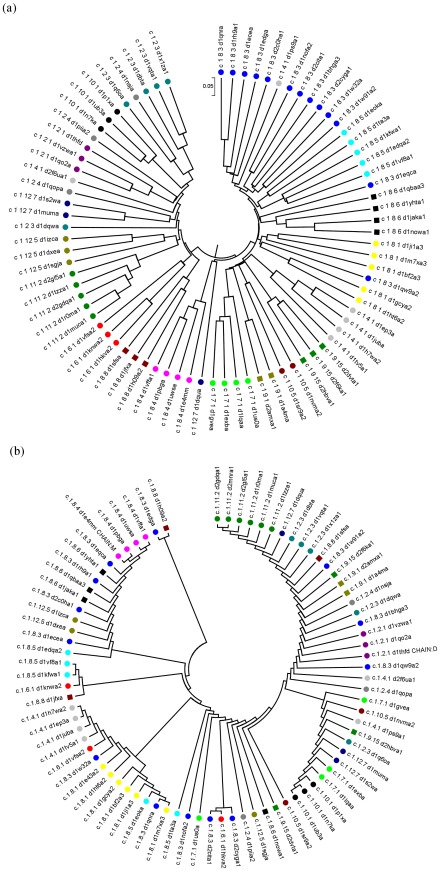
Figure 6. Comparison of network and sequence based cladograms.
A comparison of interaction based and sequence based phylogenetic analysis. (a) The cladogram of the hierarchical clustering of the members from network similarity scores (Methods Section). (b) The cladogram of the sequence based phylogeny. For sequence based phylogeny a Maximum Likelihood based statistical method was used for phylogenetic reconstruction.

