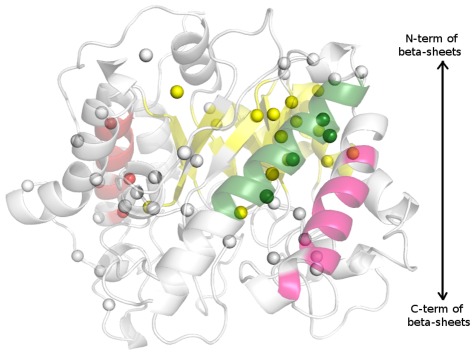
Figure 7. Comparison of f–PEN clusters and SCA sectors for β–glycanase family.
A comparison of the cluster residues obtained from f–PEN and the Sector residues identified from SCA of β–glycanase family. The residues are mapped on the backbone cartoon structure of bacterial cellulose catalytic domain (PDB id: 1EDG). The top four clusters are rendered in yellow, green, magenta and red color backbone representation. The yellow, green, magenta and red spheres are the Sector residues from SCA matching with residues in the clusters of corresponding color. The grey spheres are from Sector, which do not match with the cluster residues (similarly, there are cluster residues which do not match with the Sector residues).

