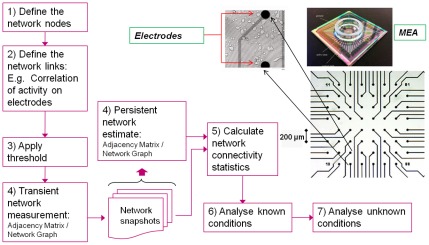
Figure 1. Steps in functional connectivity analysis of multi-electrode array data.
Steps 1–3 and step 5 are based on recommendations from Bullmore & Sporns (Nature Reviews Neuroscience, 2009). Steps 4, 6 and 7 refer to techniques specific to analysis of culture activity recorded from multi-electrode arrays (MEAs, example pictured top right). The 8×8 grid indicates the recording area of the MEA (inset: close-up of two electrodes with visible neurons in their vicinity).

