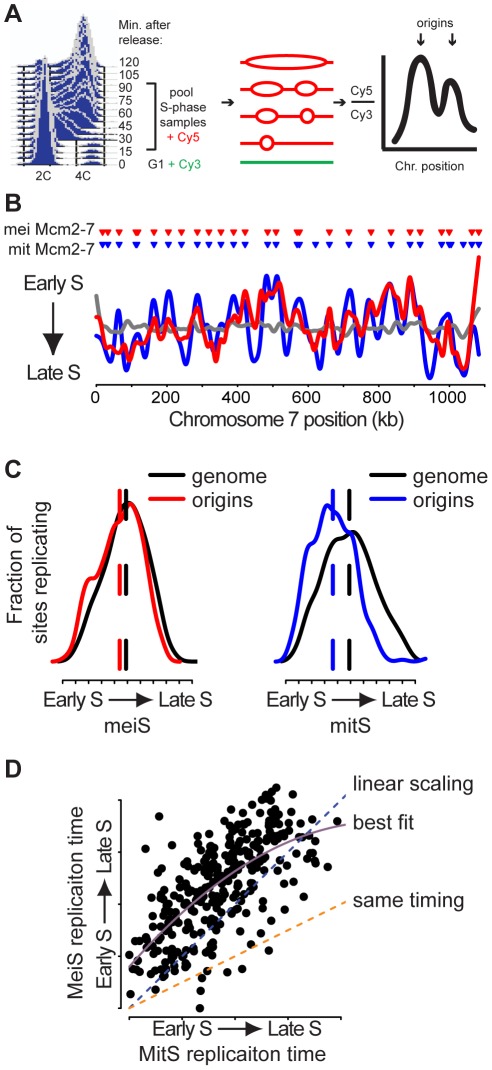
Figure 2. Meiotic DNA replication profiles.
(A) Ime2-as1-myc homozygous diploid cells (KBY518) were synchronized in meiS. DNA samples were collected every 7.5 minutes. Resulting samples were pooled and co-hybridized with a G1 DNA sample to a tiled genomic microarray. (B) Replication profiles for meiS (KBY518, red line), mitS (SB1505, blue line) and control G1 vs. G1 (SB1505, grey line) hybridizations were created by plotting the smoothed log2 ratio (see Materials and Methods) versus chromosome VII position. Triangles indicate the positions of Mcm2-7 binding sites prior to meiosis (red) and mitosis (blue). (C) The distribution of relative replication time for all origins (colored lines) and for the entire genome (black lines) is plotted for meiS (left panel) and mitS phase (right panel). (D) The replication time in meiS of Mcm2-7 binding sites that were present in both cell cycles were plotted as a function of mitS replication time. Assuming meiS is twice as long as mitS, the orange dashed line indicates the predicted meiS replication time if origins replicated with the same kinetics in meiS and mitS. The blue dashed line is the predicted replication time trend line if scaling were linear with respect to S phase length. The purple solid line is the second order polynomial best-fit model.

