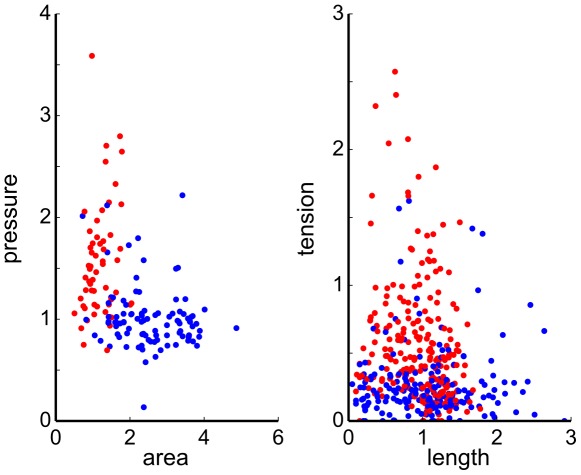
Figure 6. Inferred tensions and pressures for the cochlear epithelium image shown in Fig. 1A .
Hair-cell precursors and support cells correspond to red and blue dots respectively. Inferred pressure is plotted versus the observed cell area and the inferred tension is plotted versus edge length. Note systematically higher inferred pressure and tension in the hair-cells.

