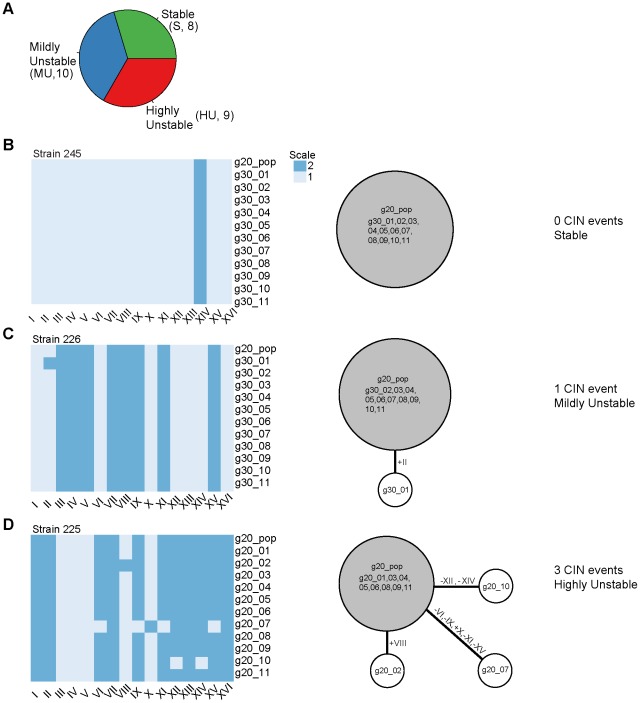
Figure 2. Determination of karyotype changes in aneuploid strain populations.
(A) Classification of the CIN level of the 27 analyzed aneuploid strains as stable (S, no CIN event linked to g20 population karyotype), mildly unstable (MU, 1 CIN event linked to g20 population karyotype) or highly unstable (HU, 2 or more CIN events linked to g20 population karyotype). The number of strains belonging to each CIN class is shown in parenthesis. (B–D) Karyotypes of the g20 population sample and of the eleven g30 colonies (left) and the reconstructed karyotype network (right) are shown for a representative S strain (B), MU strain (C) and HU strain (D). For the karyotype network, the area of the circles is proportional to the frequency each karyotype was found among the karyotyped samples (g20 population and g30 colonies); the circle containing the g20 population sample is depicted in gray; white circles represent the karyotypes of the g20 or g30 colonies (11 total) which were divergent from the g20 population karyotype due to loss (minus sign) and/or gain (plus sign) of specific chromosomes (in Roman letters). The labels inside the circles indicate the specific samples whose karyotypes are shown in the heat map on the left. Karyotypic relationship was reconstructed by using a parsimony approach and represented by lines connecting the different karyotypes; thicker connectors refer to the CIN events directly linked to the g20 population karyotype and used for the classification of the strains into CIN categories. The same information for all analyzed aneuploid strains is presented in Figure S7.

