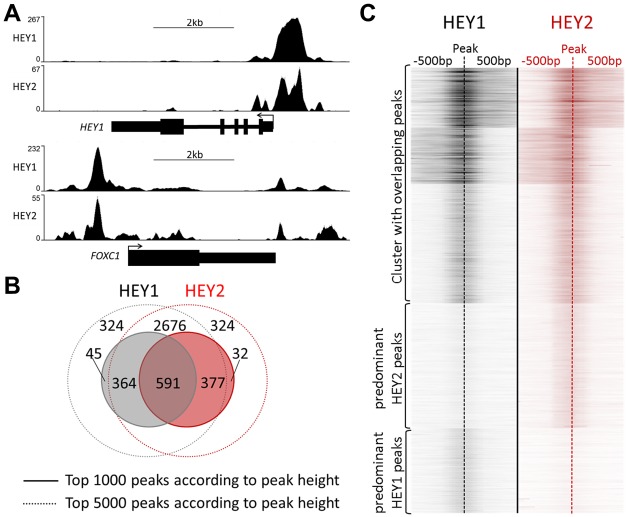
Figure 3. HEY1 and HEY2 have overlapping DNA binding characteristics.
(A) ChIPseq profiles for HEY1 and HEY2 are highly similar (examples visualized by the UCSC genome browser). (B) Venn diagram showing the overlap between the top 1000 and top 5000 peaks for HEY1 and HEY2. (C) K-means clustered heat maps of the HEY1 and HEY2 signals at all peak locations (peak summit +/−500 bp), showing three clusters with common peaks and one cluster each with weaker HEY1 versus HEY2 peaks and vice versa.

