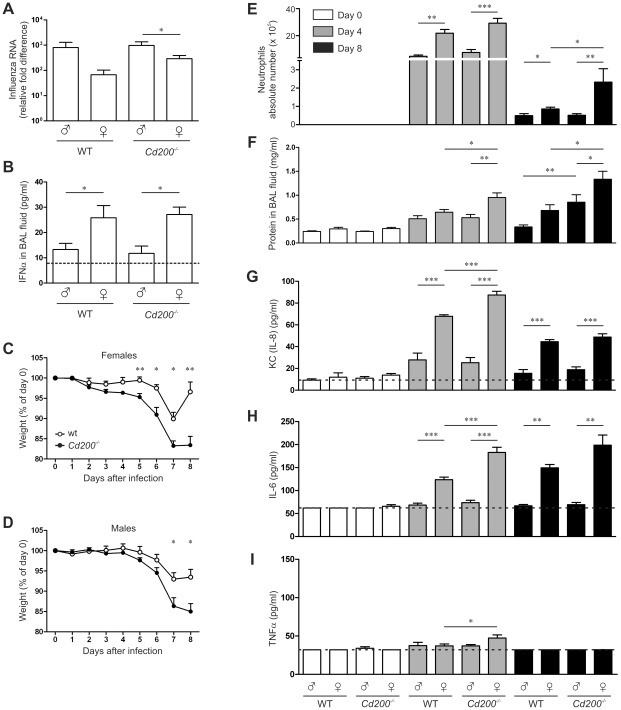
Figure 4. CD200-deficiency and sex determine the outcome of influenza A virus infection.
Naïve or influenza A virus-infected mice were sampled at indicated time points. A Relative amounts of viral RNA in the lungs were determined by qRT-PCR. B IFNα concentration in the BAL fluid was determined by ELISA. The dotted line indicates the detection limit. C, D Body weight of infected female (C) and male (D) Cd200−/− mice (filled symbols) and WT mice (open symbols) as percentage of the weight at day of infection. E Quantification of neutrophil numbers in BAL fluid by differential cell count. F Quantification of the total protein content in BAL fluid. Concentrations of KC (IL-8) (G), IL-6 (H) and TNFα (I) in the BAL fluid were measured by ELISA. In all panels mean ± SEM is shown, statistical significance was calculated with Mann-Whitney test. * = p<0.05, ** = p<0.01.

