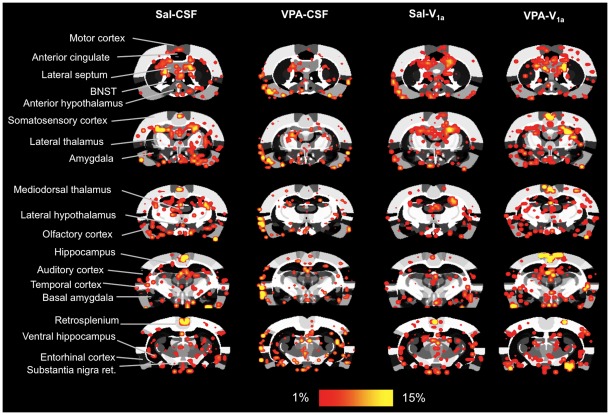
Figure 5. Blood oxygen level dependent (BOLD) response to a social stimulus in rats pre-exposed to saline and VPA during gestation.
The study design is as explained in Figure 4. Sal and VPA rats were subdivided into animals that were given an ICV injection of Sal or a vasopressin V1a receptor antagonist. The groups are: Sal-CSF (n = 10), VPA-CSF (n = 8), Sal-V1a (n = 13), and VPA-V1a (n = 10). An in vivo social stimulus juvenile was presented during scanning between repetitions 51–100, with repetitions 1–50 corresponding to baseline acquisitions (see text for details). Shown are 2D atlas maps for the different treatment conditions. BOLD maps are composites of 8–13 subject functional scans. Several ROI's included in the analysis are indicated in the far left column. Scale bar hue (red-yellow) shown at the bottom indicates the percentage change (from 1–15%) for areas of increased activity.

