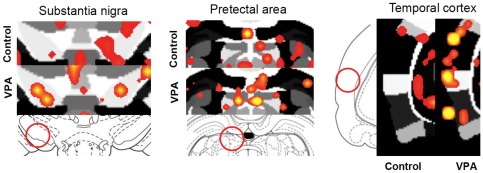
Figure 6. Social stimulus-induced changes in BOLD in rats pre-exposed to saline (Sal) and VPA during gestation.
The study design is as explained in Figures 4 and 5. An in vivo social stimulus juvenile was presented during scanning between repetitions 51–100, with repetitions 1–50 corresponding to baseline acquisitions (see text for details). Shown are 2D atlas maps for two treatment conditions (Sal and VPA). Close ups highlight several ROI's of saline control and VPA treated animal's. Scale bar hue (red-yellow) shown at the bottom indicates the percentage change (from 1–15%) for areas of increased activity. Note predominant yellow hue (indicative of higher activity) pixels in VPA-CSF compared to saline (Sal-CSF).

