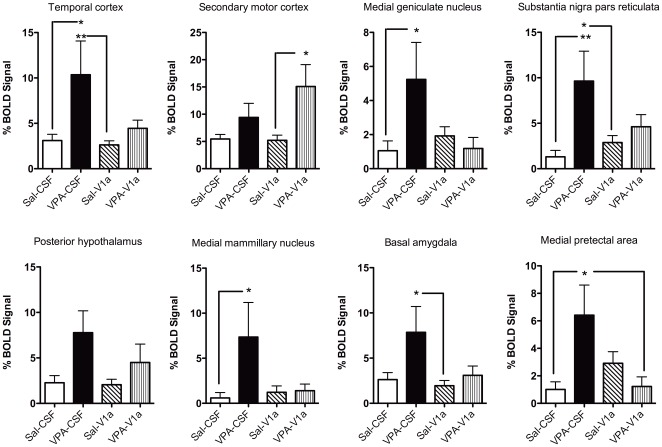
Figure 7. Social stimulus-induced changes in BOLD in rats pre-exposed to saline (Sal) and VPA during gestation.
The study design is as explained in Figures 4 and 5. Sal and VPA rats were subdivided into animals that were given an ICV injection of Sal or a vasopressin V1a receptor antagonist. The groups are: Sal-CSF (open bar), VPA-CSF (close bar), Sal-V1a (diagonal patterned), and VPA-V1a (upward patterned). The percent changes correspond to the averaged timecourse for the stimulus epoch. Graphs show percent change in BOLD across groups for various ROI's. Data shown as mean ± standard error. Asterisks and lines indicate specific posthoc comparisons with * p<0.05 and **p<0.01 (two way ANOVA).

