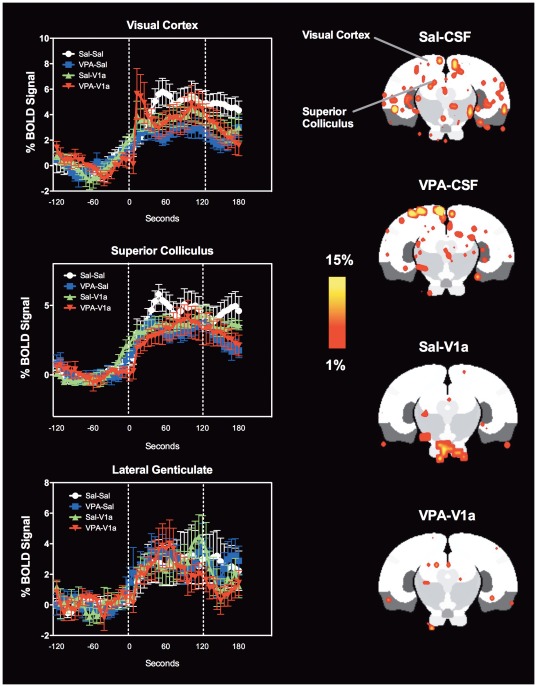
Figure 9. Visual system BOLD activation in response to 2 Hz flashing LED in rats pre-exposed to saline and VPA during gestation.
The study design is as explained in Figures 4 and 5. Sal and VPA rats were subdivided into animals that were given an ICV injection of Sal or a vasopressin V1a receptor antagonist. Left column shows BOLD signal time courses for the visual cortex, superior colliculus and lateral genticulate nucleus. The groups are: Sal-CSF (white circles), VPA-CSF (blue squares), Sal-V1a (green triangles), and VPA-V1a (red inverted triangles). Data shown as mean ± standard error. BOLD signal changes in Sal-CSF rats (white circles) were greater in the visual cortex than VPA-CSF rats (p<0.05, repeated measures ANOVA). Shown on the right are 2D maps at the level of the visual cortex. Scale bar hue (red-yellow) indicates the percentage change (from 1–15%) for areas of increased activity.

