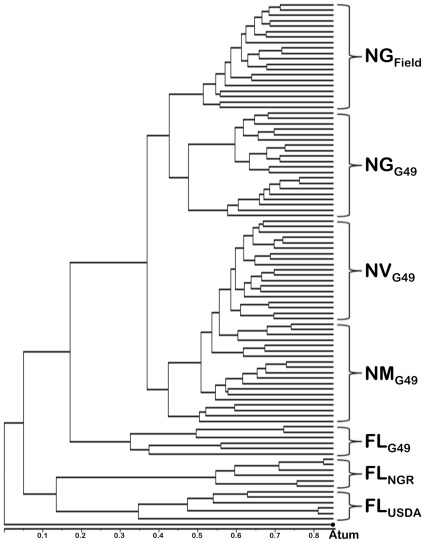
Figure 3. Typing of bacteroids found in nodules of a soybean field.
Unsupervised hierarchical cluster analysis (Dice algorithm) of complex MALDI-TOF MS spectra (m/z 3000 to 15000) of rhizobia found inside nodules of G. max from a field in the Swiss state of Ticino (NGField), or of G49 isolated from nodules of soybean (NGG49), siratro (NMG49), and cowpea (NVG49). Spectra from free-living cells of G49 (FLG49), NGR234 (FLNGR), and USDA257 (FLUSDA), were also included. A. tumefaciens (Atum) was used as an outgroup.

