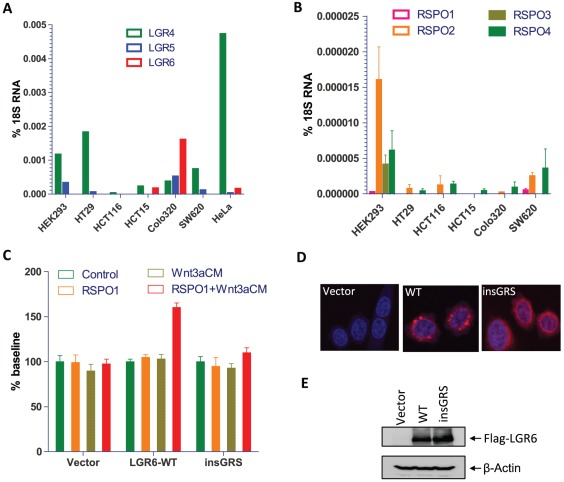
Figure 5. Expression profiling of LGR4–6 and RSPO1–4 and migration assay of HeLa cells overexpressing LGR6.
A, Expression levels of LGR4–6 in HEK293 cells and a panel of cancer cell lines determined by quantitative RT-PCR analysis. B, Expression levels of RPSO1–4 in HEK293 and a panel of colon cancer cell lines determined by qPCR analysis. C, Cell migration analysis of HeLa cells stably expressing vector, LGR6-WT or insGRS after treatments with vehicle control, RSPO1,Wnt3a-CM, or RSPO1+Wnt3a. Data are presented at mean ± S.E.M. of three replicates after normalization to vehicle control. The experiment was repeated once and both showed similar results. D & E, Expression analysis of LGR6-WT and insGRS in HeLa cells by confocal immunofluorescence (D) and immunblotting (E) using an anti-Flag antibody.

