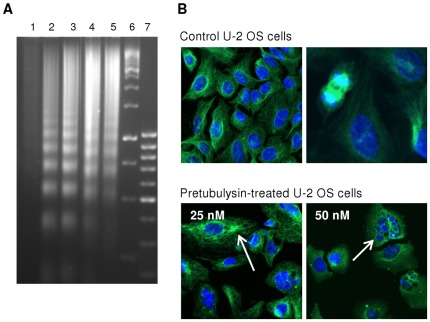
Figure 4. Typical cellular events upon pretubulysin treatment.
A) Isolated DNA of human promyelocytic HL-60 cells treated with pretubulysin (1: control, 2: 30 nM, 24 h; 3: 75 nM, 24 h; 4: 30 nM, 48 h; 5: 75 nM, 48 h; 6: standard 1000 bp ladder; 7: standard 100 bp ladder). B) Human U-2 OS osteosarcoma cells that were left untreated (upper panel) or were treated for 24 h with pretubulysin (lower panel). Microtubules are visualized by immunofluorescence staining of α-tubulin (pseudocolor green), and nuclei were stained with Hoechst 33342 (pseudocolor blue). The arrows indicate the abnormal accumulation of microtubules in cells after treatment with 25 nM pretubulysin; fragmented nuclei, and completely depolymerized microtubules were observed at a drug concentration of 50 nM.

