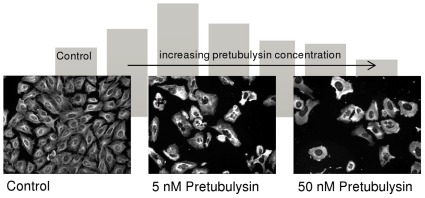
Figure 9. HC images of control U-2 OS cells and cells treated with pretubulysin.
α-Tubulin was visualized by immunofluorescence, and images were acquired with 200-fold magnification on a BD Pathway 855 automated microscope. The background shows the details of the HC analysis of the SD of tubulin fluorescence (Figure 8).

