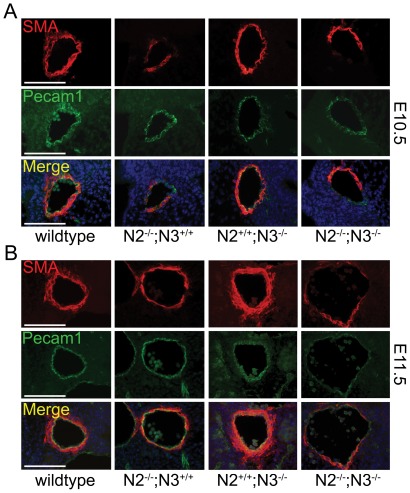
Figure 4. Notch2 and Notch2/Notch3 double mutant embryos exhibit diminished smooth muscle cell marker expression.
Transverse sections of embryos at E10.5 (A) and E11.5 (B) were stained for SMA (red) and Pecam1 (green). Notch2−/− (N2−/−;N3+/+) and Notch2−/−;Notch3−/− (N2−/−;N3−/−) embryos exhibit less SMA-positive cells in the dorsal aorta at E10.5 compared to wild-type and Notch3−/− (N2+/+;N3−/−) embryos, while Pecam1 levels are similar in all genotypes. At E11.5, Notch2−/−;Notch3−/− embryos show an even greater loss of SMA expression, with increased vessel diameter. Merged images also show DAPI stain (blue) to highlight nuclei. Scale bar = 100 µm.

