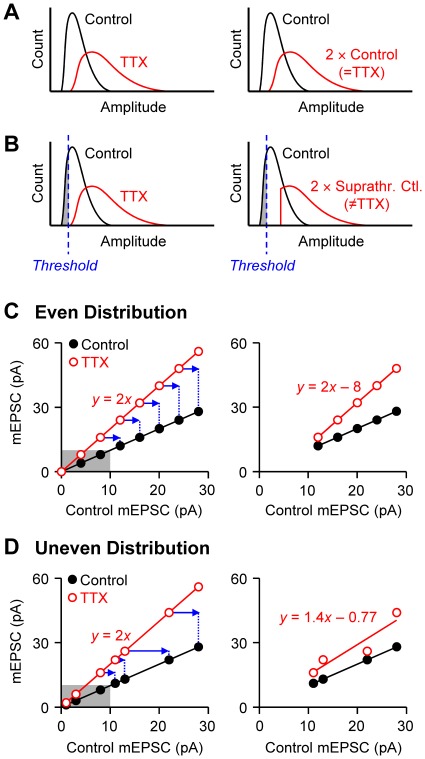
Figure 2. Schematic diagrams illustrating the inadequacy of the previous test for multiplicative scaling.
A. Hypothetical distribution curves, in which all of the mEPSC amplitudes are included without a detection threshold. The TTX-treated mEPSCs are assumed to be two-fold larger than the controls (i.e., multiplicative scaling; left). If the control population is multiplied by two (right), the scaled control curve becomes identical to the TTX curve. B. Schematic diagrams similar to A, but a detection threshold of mEPSC amplitude limits the minimum amplitude (left), as in realistic mEPSC recordings. If the suprathreshold control values (i.e., excluding the gray area) are multiplied by two (right), the minimum offset of the scaled curve (red) will be shifted by two-fold, resulting in a mismatch with the TTX curve (left graph). This suggests that a transformation of y = ax cannot be used to test for multiplicative scaling when a detection threshold is present. C. Schematic diagrams show how the exclusion of subthreshold amplitudes invalidates the rank-order method of the conventional multiplicative scaling test. Hypothetical mEPSC amplitudes distributed evenly are rank-order plotted. TTX-treated mEPSCs (open circles) are assumed to be two-fold larger (y = 2x) than control ones (filled circles). The left graph shows an ideal, full range of mEPSC amplitudes, including the subthreshold values (<10 pA; gray area). If the subthreshold data are discarded, as in realistic mEPSC recordings, the rank-order plot of TTX data will be shifted (blue arrows). A linear fit of the TTX data in the resultant rank-order plot (right graph) now gives y = 2x–8. D. Schematic illustrations similar to C, but with data distributed unevenly. The TTX data (open circles) again constitute a multiplicative scaling of the controls by a two-fold (left graph). The exclusion of subthreshold data points (gray area) will cause a shift of the remaining data by different distances (blue arrows). A linear fit of the new rank-order plot of TTX-treated data (right graph) yields an equation that loses information about the original multiplicative scaling factor. When the TTX data in the right graph were fitted with a y-intercept of 0, the equation was y = 1.45x (line not shown), again different from the original scaling function.

