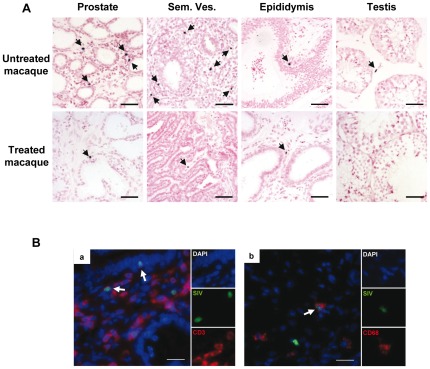
Figure 5. SIV RNA+ cells detection and identification within MGT of acutely infected macaques treated or not.
(A) Non radioactive ISH for SIV viral RNA in the MGT organs of untreated versus treated animals. Arrows indicate SIV RNA+ cells. Scale bar = 50 µm. (B) Identification of SIV-expressing cells using non radioactive ISH for SIV (green) combined with immunofluorescence for cell marker CD3 (a, red) or CD68 (b, red). Nuclei labeled with DAPI are shown in blue. Side panels represent individual channels. Large panel represents a merged image combining all channels. Arrows show co-labeled cells. Scale bars = 20 µm.

