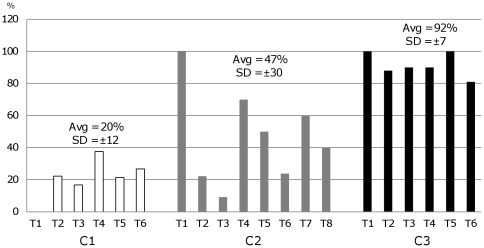
Figure 6. Temporal characterization of psyllid colonies.
Percentage of psyllids positive for the presence of Candidatus Liberibacter solanacearum (CLs) were determined by conventional PCR of a 16S rDNA specific region at irregular time points (T1 to T8). The colonies evaluated were C1, a psyllid colony with low titer of CLs, and C2 and C3, which were known to contain higher titers of CLs. The average (Avg) and the standard deviation (STDEV) for each colony were calculated and are shown above each group of time points. Y axis, percentage of positive psyllids; X axis, time points. Sample dates separated by one or more days.

