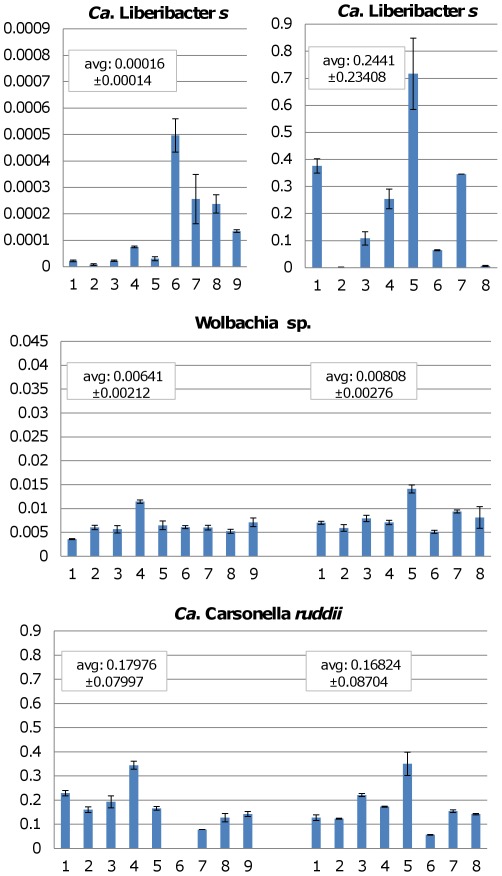
Figure 7. Relative expression of specific gene amplicons by RT-qPCR.
Columns represent the different microbial titers in the potato psyllid vector and bars denote average values of three technical repeats for individual psyllids normalized to psyllid 28S rDNA. C1 and C2 correspond to the psyllid colonies with low- and high-CLs abundance, respectively. Notice that the values for the Ca. Liberibacter solanacearum in colony 1 (C1) are extremely low and therefore are shown on a 1/1000 fold scale compare to the other graphs. The average and SDEV for each group of samples were calculated and shown in boxes above their respective graphs. A statistical analysis one-way ANOVA using SPSS 14.0 and Tukey mean comparison with P = 0.01 showed that there are significant statistical differences in the CLs titers of C1 and C2 psyllid colonies, but no differences between titers of Candidatus Carsonella ruddi or Wolbachia sp.

