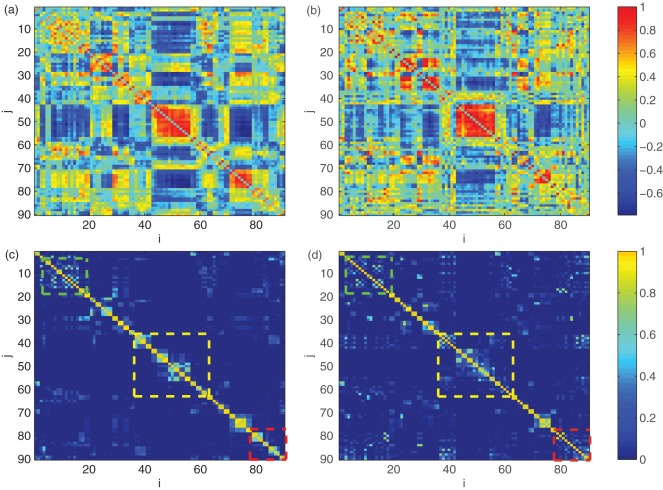
Figure 1. Visualization of Cross-Correlation matrix (a and b) versus Community matrix K (c and d) for the same healthy control (left column) and epileptic patient (right column).
From c and d we can see that the pixels distributed near the main diagonal are much brighter in healthy subjects than those in patients, as are highlighted by the three boxes, which cannot be observed in cross-correlation matrix (a and b). These pixels mostly correspond to the functional connections across the two hemispheres.

