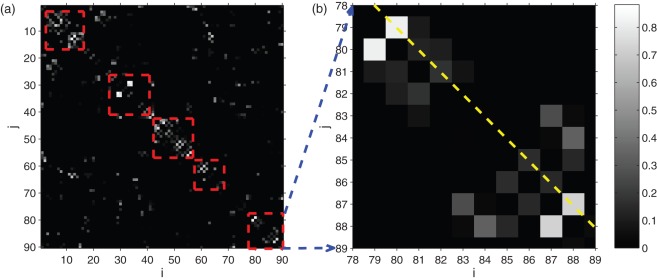
Figure 3. Visualization of group difference in terms of community matrix K, b is an enlargement of a.
The white pixels correspond to edges in K that are more discriminative across the two groups (these edges have a larger regression coefficient in sparse regression). Specifically, the second main diagonal (as is indicated by a yellow dashed line in b) contains connectivities between pairs of bilaterally homologous brain regions. In figure b, the connectivities between brain region 79 and 80 (left and right heschl), 87 and 88 (left and right temporal-pol-mid) are most significant. Here we highlight most of the discriminative edges in by 5 red boxes, which belong to frontal, limbic, occipital, parietal, and temporal lobe, respectively.

