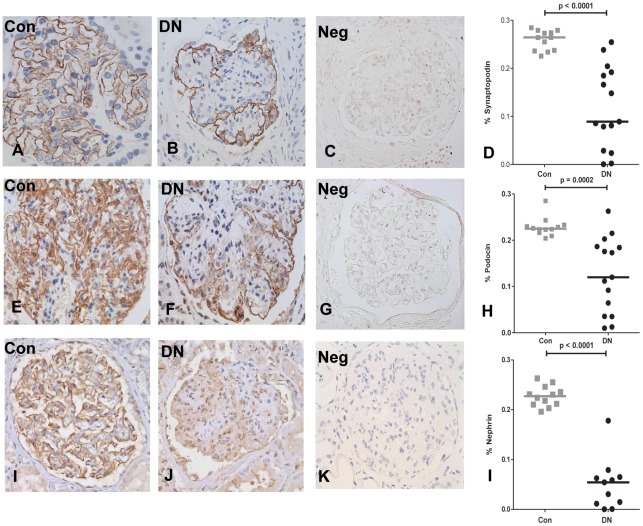
Figure 1. Synaptopodin, podocin, and nephrin are significantly downregulated in diabetic nephropathy (DN) as compared to controls (Con).
Representative staining of synaptopodin in Con (A), DN (B), podocin in Con (E) and DN (F), and nephrin in Con (I) and DN (J). Negative controls without administration of primary antibody are represented for synaptopodin (C), podocin (G), and nephrin (K). Quantification of synaptopodin (D), podocin (H), and nephrin (L) positive area per glomerular tuft in Con (12 patients) and DN (15 patients). Horizontal lines represent the median value. *Number of DN biopsies for nephrin was 11 due to lack of remaining tissue.

