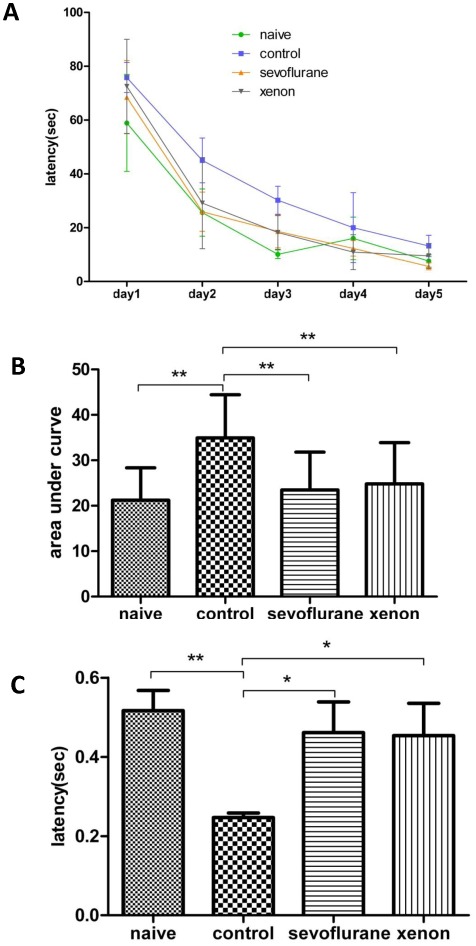
Figure 5. Neurocognitive behavior at PND 50.
A shows the average latencies, the time required for each animal to reach the hidden platform, of the four trials for the initial 5 days. B shows the area under curve (AUC) derived from A. C shows the percentage of the time the rats spent in the platform area in the probe trial on the 6th testing day. Control group have significant neurocognitive impairment when compared to naïve group. There is no difference between sevoflurane, xenon groups and naïve group. D shows there is no difference in the average velocity in each group. Data are expressed as mean ± SEM (n = 5–6) and compared by one-way analysis of variance and Student-Newman-Keuls method. * p<0.05, **p<0.01.

