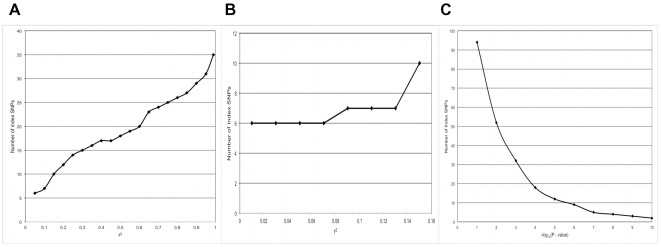
Figure 4. Results of sensitivity analysis for SNP grouping analysis showing the relationship between the group linkage disequilibrium parameter (r 2) and the number of index SNPs identified, with r 2 ranging from (a) 0.05 to 0.95, and focused on the range from (b) 0.01 to 0.15.
Results (c) show the relationship between the minimum statistical significance parameter for the association between the disease and the index SNP and the number of index SNPs identified.

