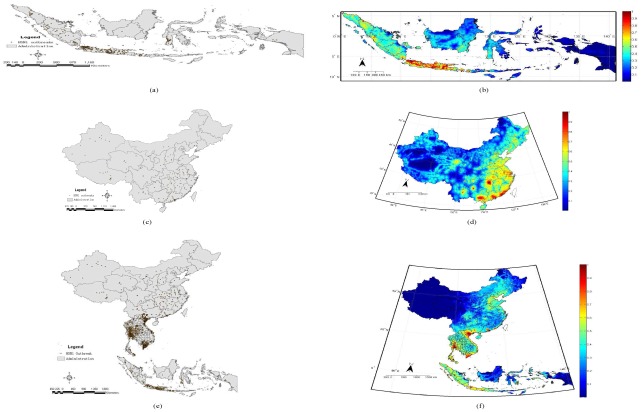
Figure 2. The spatial pattern of H5N1 in Indonesia, China, and East-Southeast Asia.
(a), (c), (e) show the distribution of observed H5N1 outbreaks; (b), (d), and (f) show the probability maps integrating the findings of the phylogenetic analysis ( Figures S2(a), (d), and (g)), the modified local K function analysis (Figures S2(b), (e), and (h)), and the logistic regression analysis (Figures S2(c), (f), and (i)). The closer the probability is to 1, the greater is the probability of an H5N1 outbreaks.

