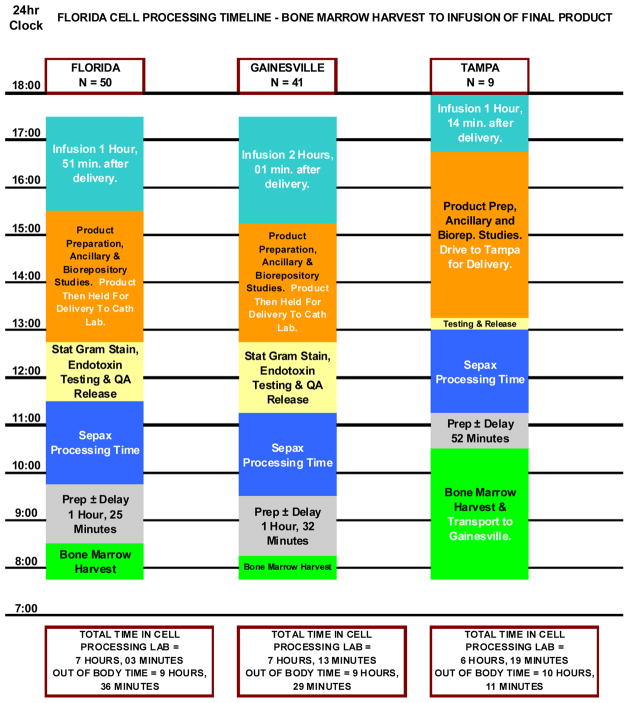
Figure 3.
Breakdown of the out of body time is shown for all products prepared at a single center (far left column). The center column shows the data for products administered locally at the clinical site associated with that processing center. The right hand column shows data from products collected at a distant satellite, transported to the same processing center and then returned to the satellite for administration. The overall times are similar, reflecting the request to hold products for local delivery until requested by the cardiac catheterization laboratory. This compensated for the transportation time from and to the satellite clinical center.

