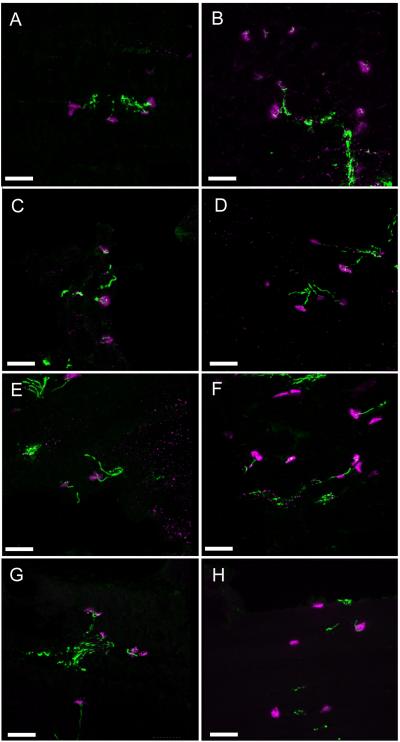
Figure 5.
Extended focus images of TA and EDL neuromuscular junctions by confocal laser scanning microscopy. Acetylcholine receptors are labeled in magenta and neurofilaments are labeled in green. B,D,F and H are representative images from SMA affected TA (B and F) and EDL (D and H) sections at 10 (B and D) and 12 weeks (F and H). A,C,E and G are representative images from age and tissue matched controls. A) 35 optical sections representing a thickness of 10.5 μm. B) 60 optical sections representing a thickness of 18 μm. C) 71 optical sections representing a thickness of 14.2 μm. D) 61 optical sections representing a thickness of 18.3 μm. E) 68 optical sections representing a thickness of 20 μm. F) 65 optical sections representing a thickness of 19.5 μm. G) 76 optical sections representing a thickness of 15.2 μm. H) 91 optical sections representing a thickness of 18.2 μm. Bar = 50 μm.

