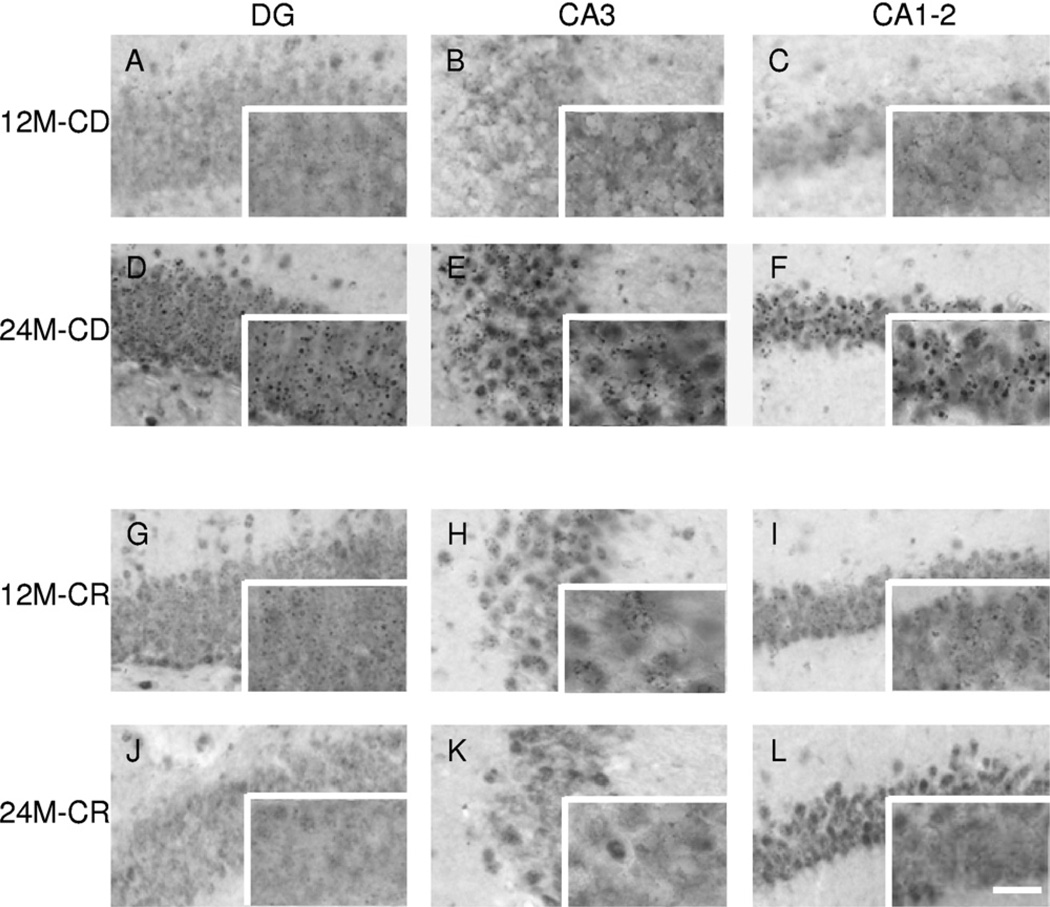
Fig. 3.
Representative images of 5-methylcytidine (5-mC) immunoreactivity (IR). High-magnification images of 5-mC IR. Representative images of the hippocampal regions dentate gyrus (DG), CA3, and CA1–2 are presented for a 12-month-old control diet (CD) mouse in (A), (B), and (C), for a 24-month-old CD mouse in (D), (E), and (F), for a 12-month-old caloric restriction (CR) mouse in (G), (H), and (I), and for a 24-month-old CR mouse in (J), (K), and (L). Note: An evident increase in 5-mC IR from 12 to 24 months in CD mice, which is not seen in CR mice. The full size images were taken with a 40× objective while the images in the bottom right box of each micrograph with a 100× objective. Scale bar = 20 µm in images (A–L) and 50 µm in the high-magnification images in the bottom right boxes.

