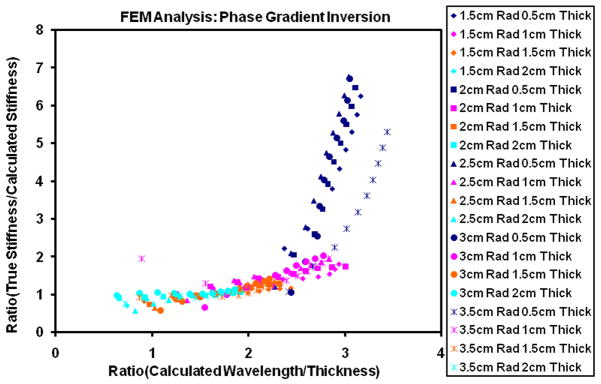
Figure 2.
Plot demonstres the deviation of calculated stiffness values obtained using phase gradient inversion on a spherical shell when compared to true values with varying thickness of the shell. X-axis represents the ratio of calculated wavelength to the thickness. Y-axis represents ratio of true stiffness value to that of calculated stiffness value. True stiffness value is provided as input to finnite element modeling for generating displacement field. Calculated stiffness value is obtained by processing the displacment field using phase gradient inversion algorithm. Calculated wavelength is obtained by using calculated stiffness value in the following equation. μcal=ρ (fλcal) 2, where μcal is the stiffness obtained using phase gradien inversion, f is the excitation frequency (80 Hz), ρ density of the material 100kg/m3 and λcal is the calculated wavelength. From the plot it can be observed that phase gradient inversion is stable when the thickness almost equal to or greater than 1.5cm.

