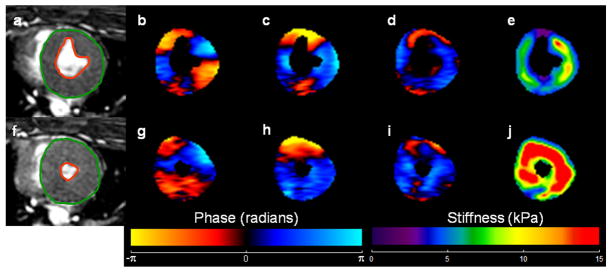
Figure 3.
a, f) End-systolic short axis SSFP image of the LV in pig #1 at baseline and after 5th infusion of epinephrine respectively. The green and orange contours show the delineation of LV myocardium. b, c, d, g, h, i) Wave images in x, y, and z motion sensitization directions during end-systole. e, j) Corresponding stiffness maps at end-systole with a mean stiffness of 5.95 ± 2 kPa and 14.03 ± 7.6 kPa respectively.

